Today
What your week looks like now
Invisible weak signals
Drifts settle in slowly — you find them when they're already expensive.
Tools that don't talk
ERP, WMS, ticketing: every system has its own truth.
Reporting that drains
Compiling the weekly committee's indicators takes hours, every week.
Your dashboard
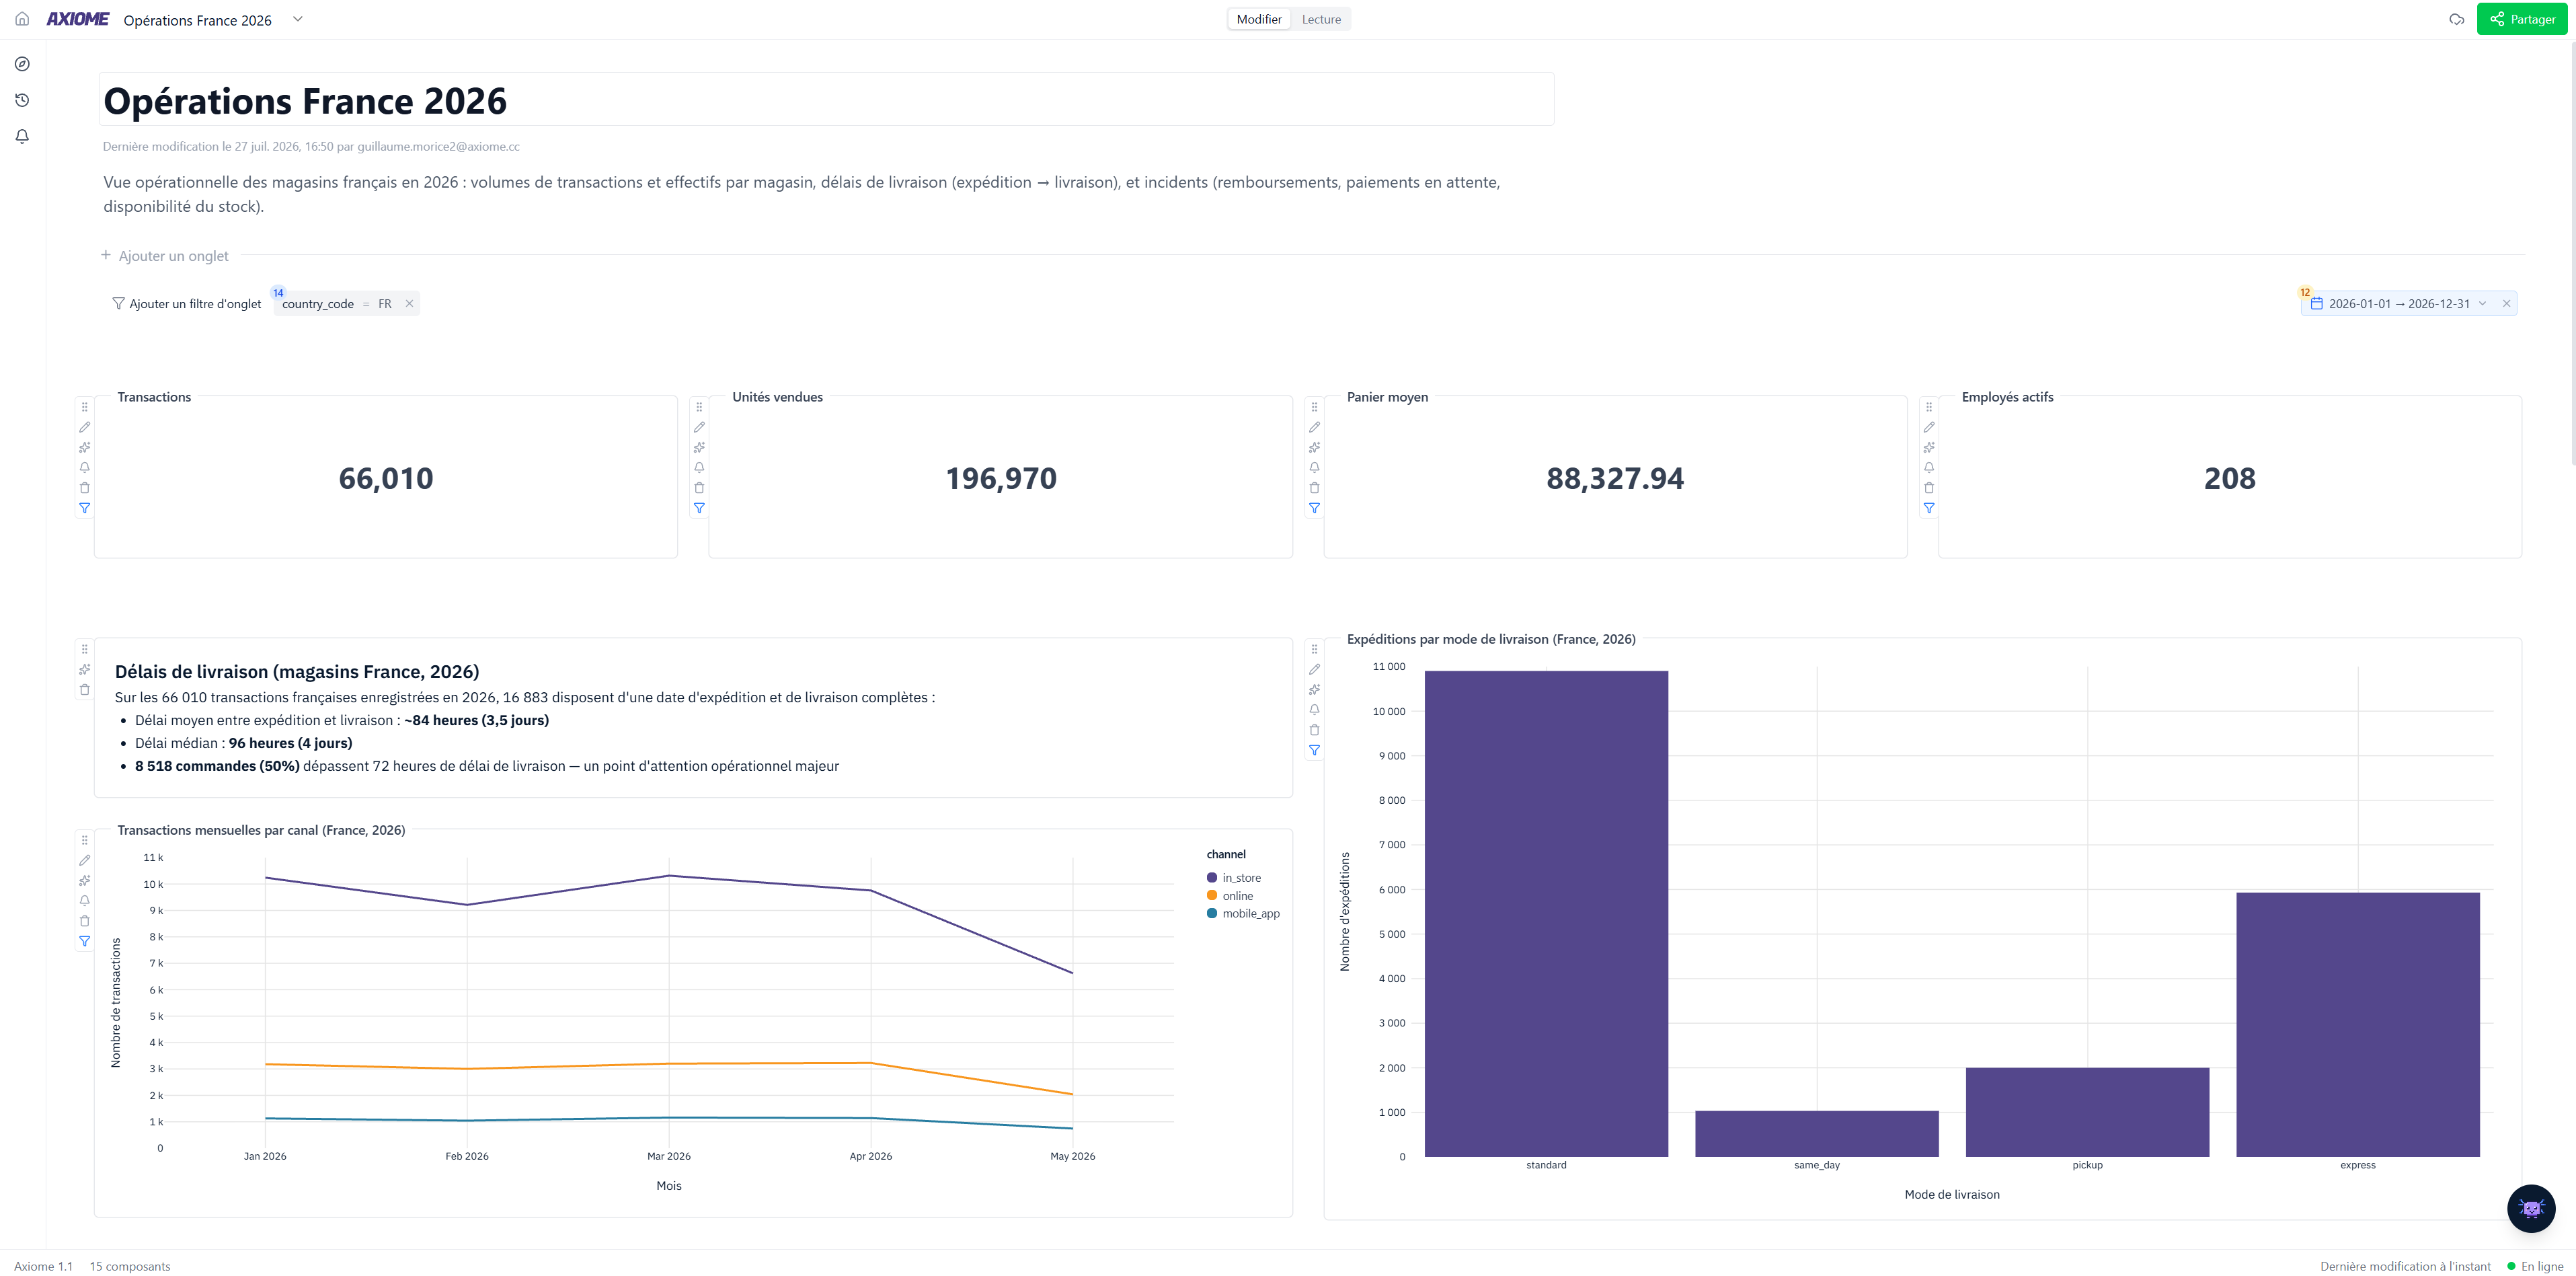
The field, in live numbers
An example of what your team builds in minutes — then queries in natural language.
Daily volume processed Incident rate Average processing time Capacity vs load Critical stock SLA compliance
What changes
Why operations teams choose Axiome
See it coming
Thresholds and alerts on your critical indicators: the team is warned before the incident.
A cross-cutting view
All your sources in the same dashboards, with shared definitions.
Understand fast
An abnormal spike? "Explain this data" and Axi details the variation.
By team
Discover the other solutions
The same data, a dashboard for every team.