Widgets
Charts (bars, lines, areas, scatter, pie), detailed tables, KPI cards with comparison, text blocks.
Real time
When a colleague — or Axi — changes something, you see it immediately. No manual refresh.
Free-form layout
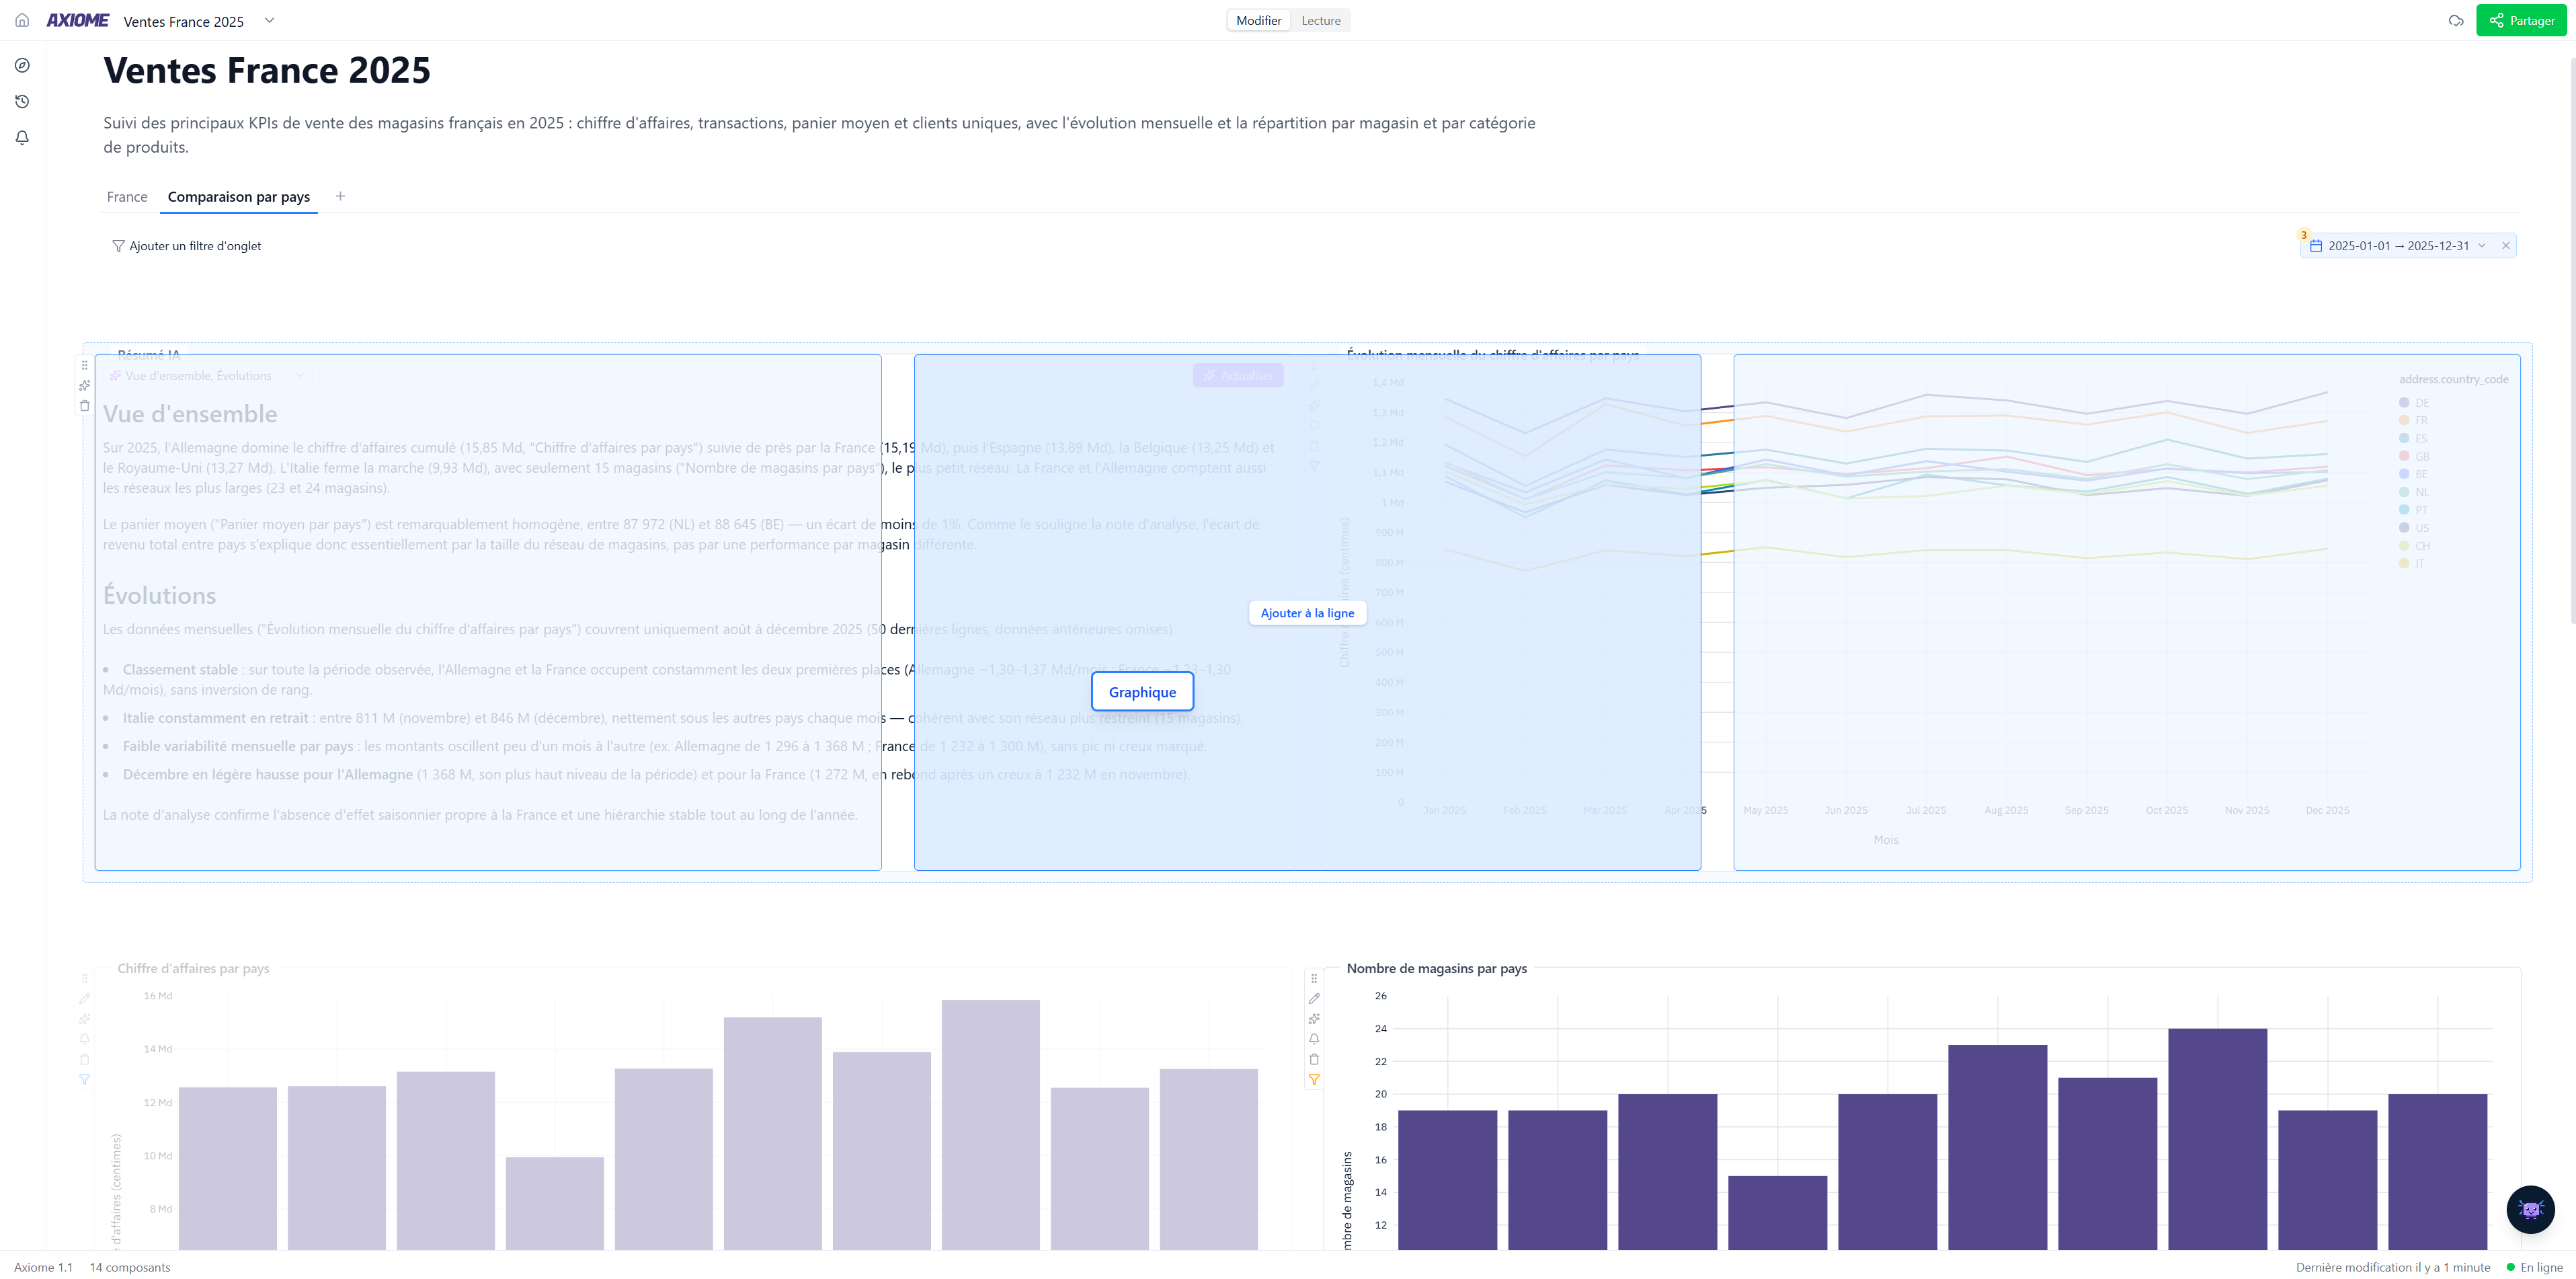
Drag, drop, resize: the grid keeps everything aligned in clean rows.
Controlled sharing
Share with access levels, star your favorites, duplicate in one click.
Build
A grid that thinks for you
Add a widget, or ask Axi for it. Move it with one gesture: rows adjust, heights align, the layout stays clean effortlessly.
- Tabs to organize your views
- Global filters (period, segment…) across the whole dashboard
- Explore panel: the map of your available data
- Continuous auto-save
Collaborate
One version, for everyone
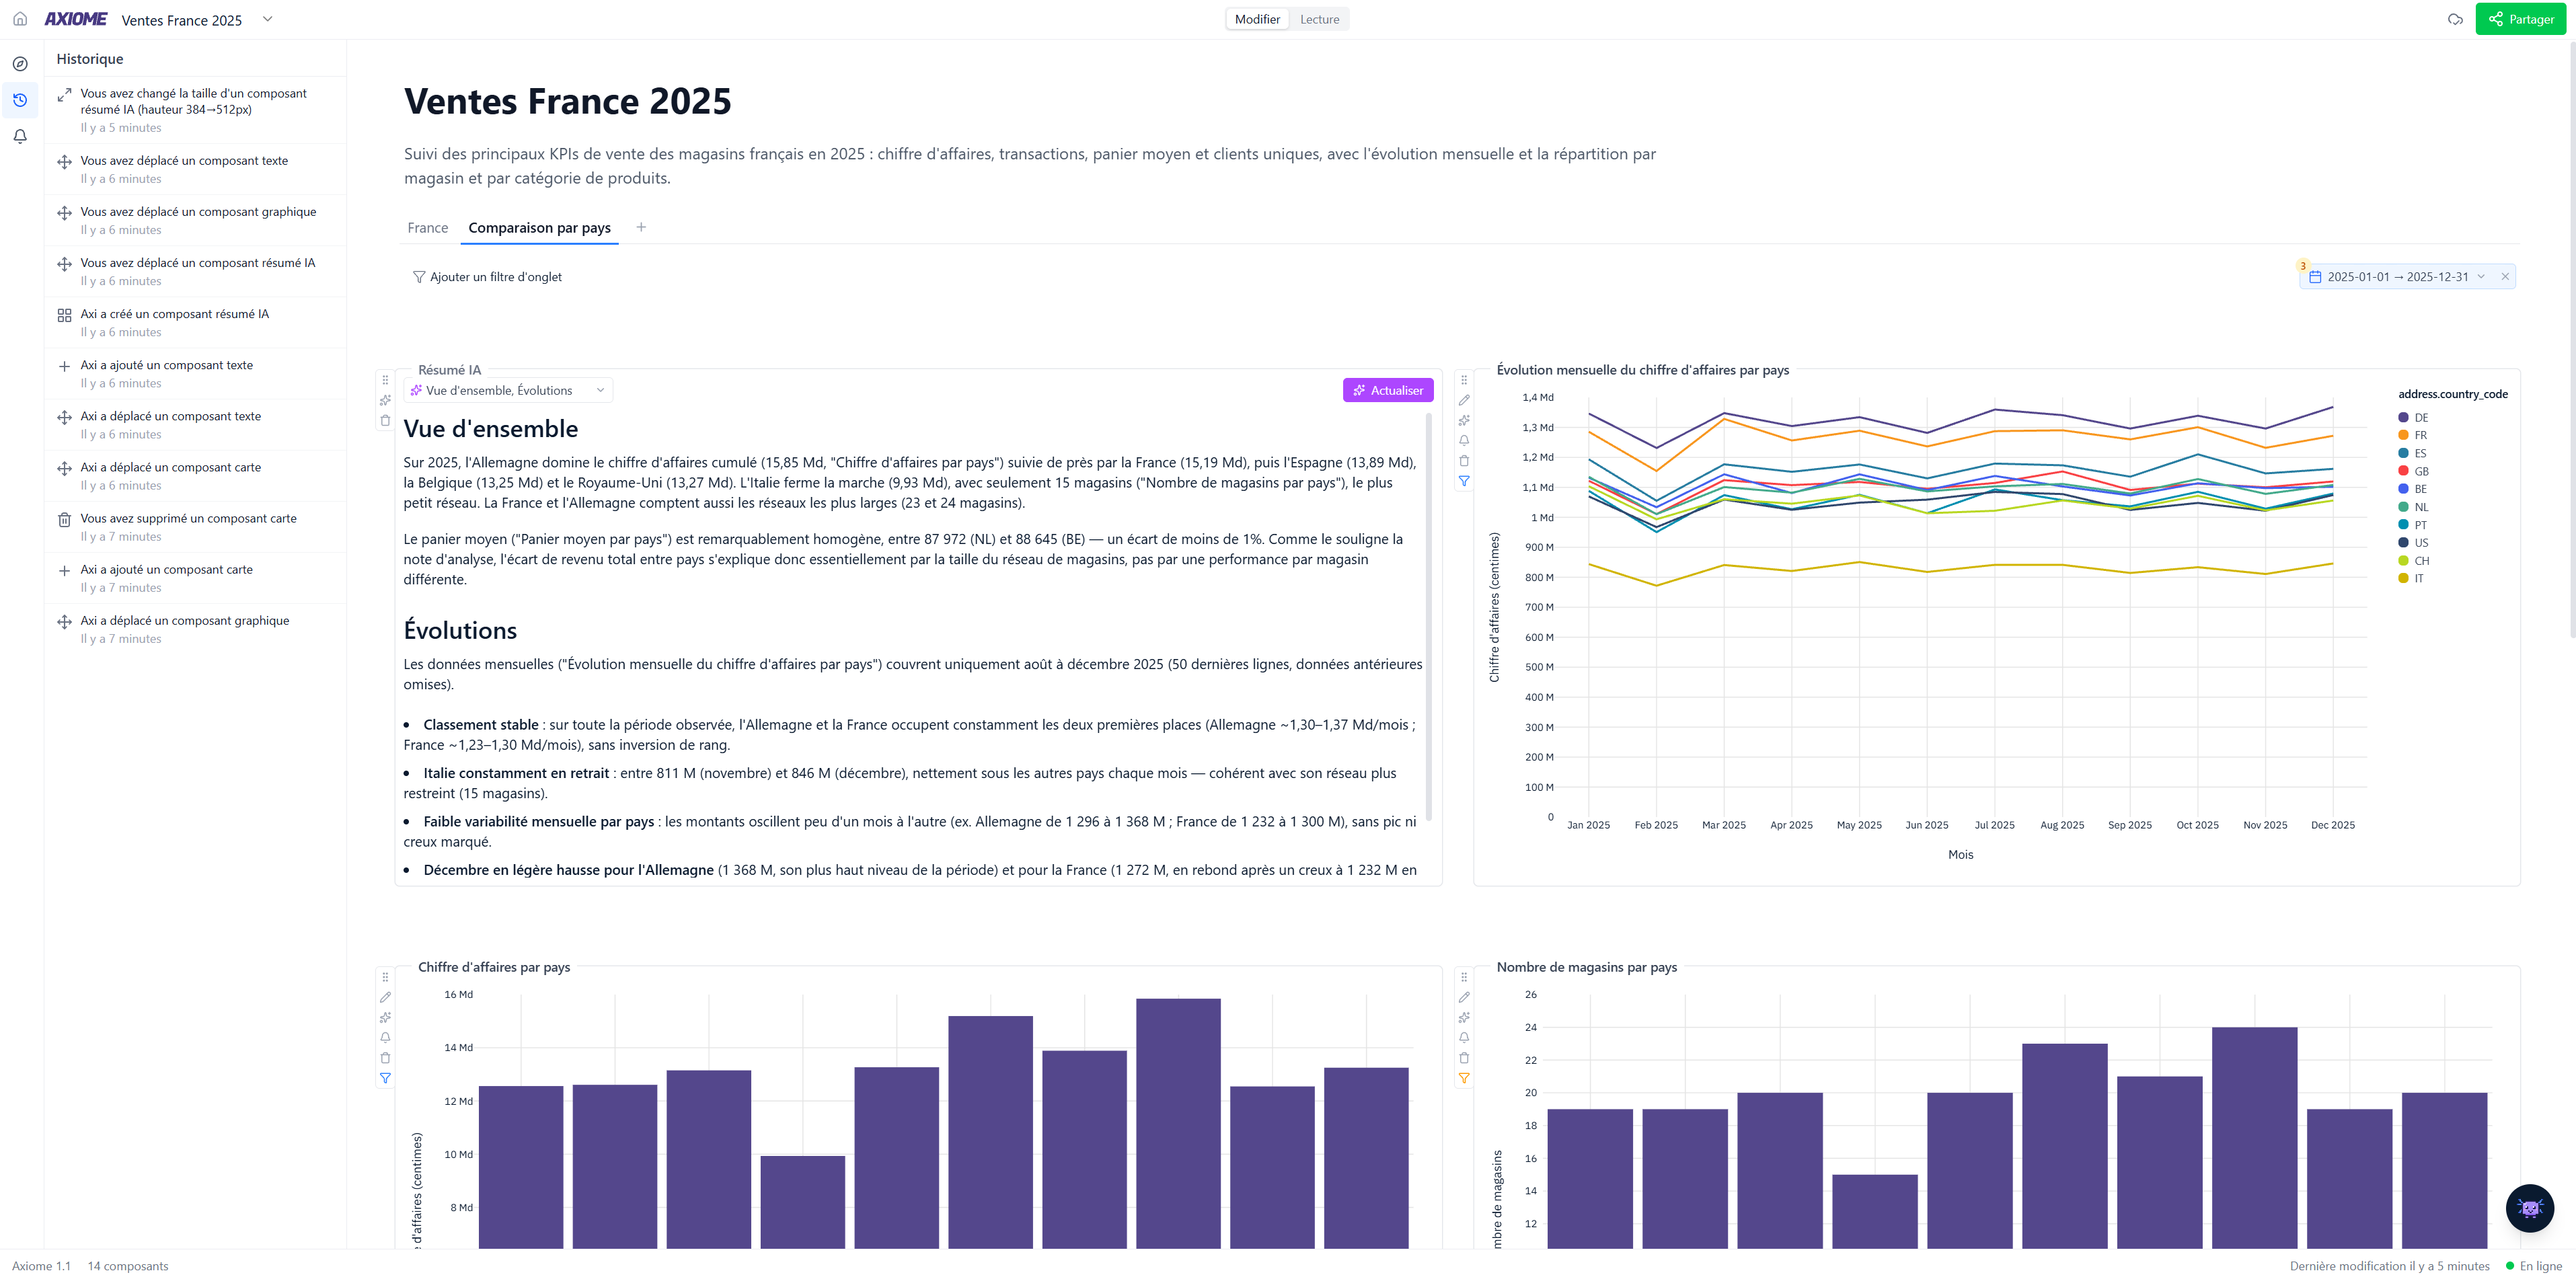
An Axiome dashboard is not a file you pass around: it's a living page, with its history and its access rights.
- Full history: who did what, and when
- Viewer, Editor and Admin roles, per person
- Favorites pinned in the sidebar
- Duplicate to iterate without risk
The product
Explore the rest of Axiome
Every piece works with the others — together they make your teams autonomous.